
There is no "Magic Bullet"

Robust Cross-Examination
The best approach to geothermal development changes with location, geology, energy needs, and real-time data that is learned while drilling. GTW uses an all-the-above approach that tailors development strategy to customer risk tolerance, budget, and goals. This means that we keep all options "on-the-table" until our robust AI-ready evaluation tools identify the optimal solution. We use validated metrics, not assumptions.

Enhanced Geothermal Example
Tensile fractures propped-open with sand particles define the Enhanced Geothermal Systems (EGS) concept that was first demonstrated in 1975 at Fenton Hill, New Mexico. Today, improvements to drilling and completion technologies (e.g., PDC drill bits, directional drilling, and multi-stage injection) enable EGS to be competitive with mainstream energy sources. GTW uses AI-ready models for EGS performance forecasting across the widest possible range of geologic conditions – all to confidently identify the most robust well designs.

Conventional modeling to predict EGS performance is extremely computationally intensive, especially because it requires consideration of fracture growth, thermal effects, and fluid flow. Often, just one model takes months to setup and hours or weeks to run with supercomputers. If we merely consider data-storage, the Earth's total data capacity of 200 ZB can only support 20 inputs in a structured-array if we want 50 outputs and 10 points per input (8 bytes x 51 outputs x 10 points ^ 21 inputs = 408 ZB).
GTW solves this problem using ensemble modeling with stochastic inputs to reduce the number of simulations required. Also, we simplify the workflow to evaluate only the most important physics at any given time. This tool is called "GeoDT" and was developed in collaboration with Los Alamos National Laboratory. Here, we show its outputs for 10,000 simulations of a 3-well EGS drilled to 250 C into a site with uncertain geologic conditions. This example has 147 inputs and 135 outputs and was completed in 7 minutes using a laptop. Its result shows that optimal economics are achieved at flow rates near 0.1 m3/s (i.e., 100 kg/s) when the thermal gradient is at least 50 C/km. The debt-levered IRR is used to compare each 30-year simulation.
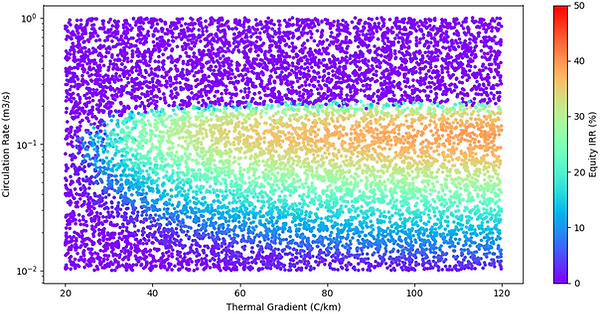
Results like this enable GTW to answer the primary question for EGS development – "Where should we drill?" The less obvious details are the best flow rate to use and best depth to target. Deeper wells access hotter rock with higher production potential and higher cost of development. GTW uses GeoDT to match reservoir design to customer needs so that the best solution will be achieved. By the same notion, we GTW can quantify the value added by various types of field-data in terms of uncertainty reduction and impact on production.


The energy need for a single customer can range from kilowatts to gigawatts. When scaled-up, value metrics tend to improve. Here we show another 10,000 scenarios to show the effect of increasing the number of wells, where a single drilling pad can accommodate 6 to 12 wells. The levelized cost of electricity with OPEX is rather stable when at least 3 wells are drilled. This means that production can be viably scaled to match demand.